Sweatscript
Typescript React
Sweatscript, pensé pour les passionnés de sport et de data, est une interface orientée données pour les utilisateurs Strava afin de visualiser leurs activités de manière plus complète et plus claire. L’application fournit des statistiques détaillées et des visualisations sur le vélo, la course et la marche, pour suivre la progression dans le temps et fixer des objectifs de distance et de dénivelé. Elle propose aussi des vues personnalisables, une utilisation efficace de l’API et un accès sécurisé via OAuth2.
Fonctionnalités principales :
-
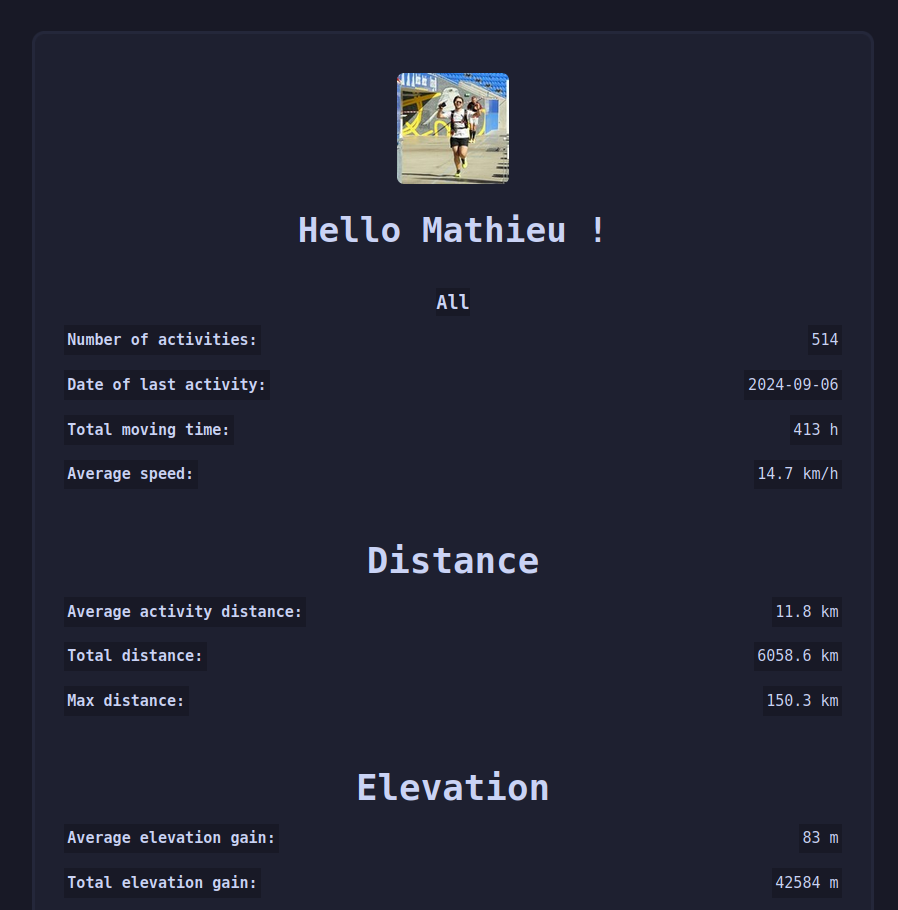
Statistiques d’activité complètes
Visualisation du temps total, de la distance parcourue, du dénivelé cumulé et du nombre d’activités pour le vélo, la course et la marche. -
Analyse détaillée des données
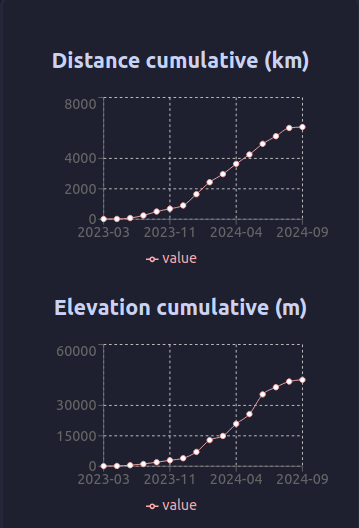
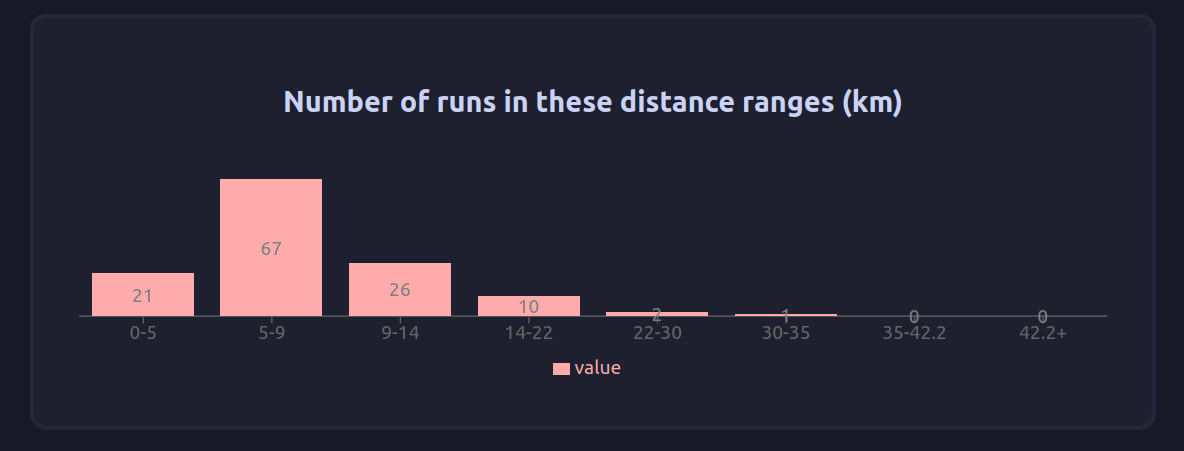
Graphiques pour suivre la progression dans le temps.
Camemberts pour la répartition des activités (temps, distance, fréquence).
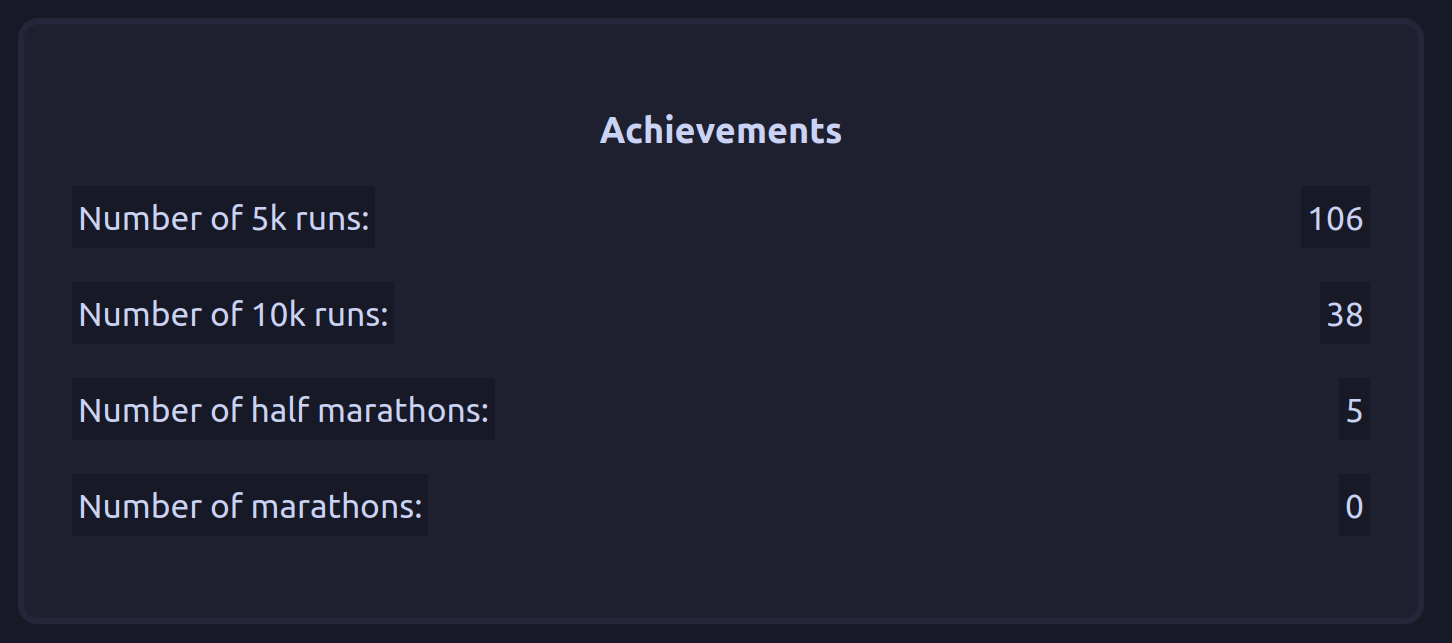
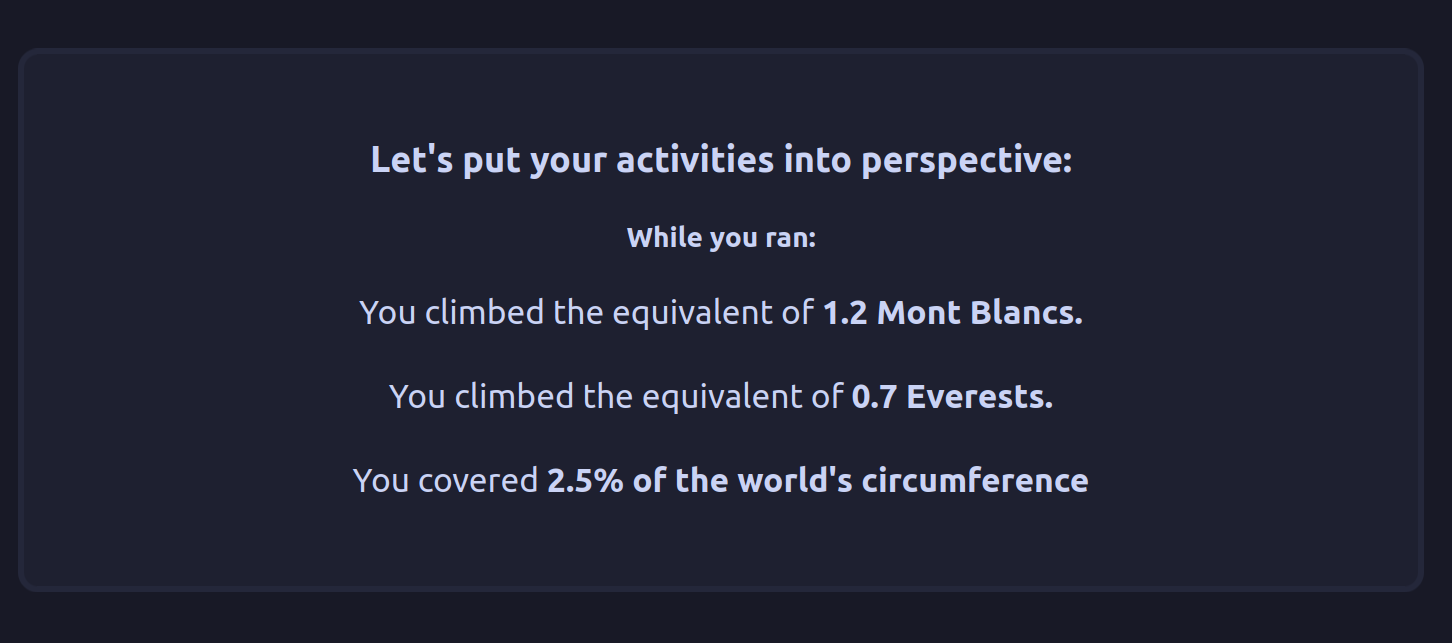
Visualisation des objectifs de distance et de dénivelé (ex. : % de la circonférence de la Terre ou de la hauteur de l’Everest). -
Vue des données personnalisable
Fusion/séparation des sorties virtuelles et réelles.
Export de toutes les données en un seul fichier JSON.
Option de suppression complète des données utilisateur en base. -
Utilisation efficace de l’API
API Strava avec intégration OAuth2 pour un accès sécurisé.
Stockage local en base pour limiter les appels API.
Le projet a été développé en TypeScript et React, avec un fort accent sur la visualisation de données et l’expérience utilisateur. Il a été réalisé dans le cadre du cours de Développement Web en 3e année FISA à Polytech Lyon, sous la supervision de M. Frederic Armetta. L’objectif était de créer une interface orientée données pour permettre aux utilisateurs Strava de mieux explorer leurs statistiques d’activité.
Captures du projet :
English version
Sweatscript, for sporty data nerds, is a data-centric UI for Strava users to visualize their activity data in a more comprehensive and user-friendly way. The app provides detailed statistics and visualizations of your cycling, running, and walking activities, allowing you to track your progress over time and set distance and elevation targets. It also offers customizable data views, efficient API use, and secure data access through OAuth2 integration.
Key Features:
-
Comprehensive Activity Stats
Visualize total time spent, distance covered, elevation gained, and number of activities for cycling, running, and walking. -
Detailed Data Breakdown
Graphs to track progress over time.
Pie charts for activity distribution (time, distance, frequency).
Visualize distance and elevation targets (e.g., % of Earth’s circumference or Everest’s height). -
Customizable Data View
Merge/Unmerge virtual rides with real ones.
Export all data in a single JSON file.
Option to delete all user data from the database. -
Efficient API Use
Strava API with OAuth2 integration for secure data access.
Local database storage to minimize API calls.
It was developed using TypeScript and React, with a focus on data visualization and user experience. The project was carried out as part of the Web Development course in the 3rd year of FISA at Polytech Lyon, under the supervision of Mr. Frederic Armetta. The objective of this project was to create a data-centric UI for Strava users to visualize their activity data in a more comprehensive and user-friendly way.
Project Screenshots: